An average American’s daily water use can exceed 2,000 liters. This includes indirect uses such as for food and clothing.
This guide shows how to find and cut water waste. It covers what a water footprint tool is, why it’s important in the U.S., and how it reveals hidden water uses.
Water use is a pressing issue. With regional droughts, old city pipes, and increased demand, saving water is crucial. Things like showers, toilets, and food production use a lot of water.
Understanding your water use helps conserve precious resources. Using water footprint calculators can show you where you use water most.
This guide is easy to follow and useful. It teaches choosing the right calculator, recording data, avoiding mistakes, and understanding results. Plus, it offers tips to use less water.
The guide includes 11 key steps: understanding water footprints; selecting a tool; recording data; analyzing results; identifying how to improve; conserving water; tracking progress; involving your community; finding more resources; and taking action for sustainable living.
Key Takeaways
- A water footprint tool shows daily water use, both seen and unseen.
- Calculators help focus on saving water and money.
- Challenges like drought and old infrastructure highlight the need for personal action.
- Correct data entry is crucial for accurate water footprint results.
- This guide provides detailed steps to effectively choose, use, and monitor a water footprint calculator.
Understanding the Water Footprint Concept
The water footprint tells us how much fresh water is used to make the things we use and consume. It shows the water we use directly, like for drinking and showering, and indirectly in things like food and clothes. The Water Footprint Network introduced this idea as a key measure for sustainability.
Definition and Importance
The idea is straightforward: it’s the total fresh water used by a person, home, or during production. It includes water we use every day at home and water used in farming, making things, and getting products to us.
Knowing the difference is important. It helps people and businesses understand which actions use more water. They can then work on saving water and sharing their efforts to be more eco-friendly.
Types of Water Footprints
Water footprints come in three types: blue, green, and gray. Blue water is the water in lakes and underground we use up. Green water is rain water plants absorb from the soil. Gray water is water that cleans pollution to keep our rivers and lakes safe.
Online tools mostly measure blue and green water. Some also look at gray water, especially if pollution is a concern. When comparing tools, it’s good to check which types they consider for a fair comparison.
Why It Matters for the Environment
Water footprints are linked to the challenge of not having enough fresh water and damaging natural habitats. Too much use by farms and companies can hurt rivers, wetlands, and city water supplies. If homes use less water, it helps save these precious resources.
Even small steps can make a big difference. By understanding and changing our water use, we can all contribute to solving water scarcity and reducing the burden on water cleaning systems. Choosing less water-intensive food and products means more water for everyone.
To give you an idea, a typical household in the U.S. uses about 300 gallons a day inside, and even more outside in the summer. The water needed to produce food adds a lot to our indirect water use. For example, making one pound of beef needs about 1,800 gallons of water, chicken needs about 470 gallons, and veggies need between 50 and 150 gallons per pound. These numbers show why it’s crucial to calculate our water footprint to find where we can make the most difference.
| Category | Example | Approx. Water Use (gallons) |
|---|---|---|
| Indoor household use | Average U.S. household per day | 300 |
| Beef (food footprint) | 1 lb cooked beef | 1,800 |
| Chicken (food footprint) | 1 lb cooked chicken | 470 |
| Vegetables (food footprint) | 1 lb mixed vegetables | 50–150 |
| Calculator coverage | Typical online tools | Blue & green common; gray varies |
Selecting the Right Water Footprint Calculator
Finding the best water footprint tool helps households understand waste and plan to reduce it. The choice depends on the need for detail, tech comfort, and local water scarcity considerations. Trying multiple calculators can highlight their differences and help pick the best one.
Popular Options Available
In the U.S., popular choices include the Water Footprint Network’s calculators and tools from WWF and the Water Research Foundation. University options, like those from the University of Twente, are known for their rigor. Local utilities and smartphone apps offer calculators that might use local water rates and data.
Features to Look For
Good calculators distinguish between direct and indirect water use. They show water use for activities like showering and gardening. When water scarcity is a local issue, regional details are key. Look for calculators that provide clear units and allow report exports with privacy in mind. Linking to smart meters or billing can also improve tracking accuracy.
User Friendliness
Easy-to-use calculators have a simple layout and guide you step by step. They include helpful hints and work well on smartphones. Features for accessibility ensure everyone can use them. U.S.-specific calculators use gallons and common appliance data, helping avoid mistakes.
Here’s a quick guide to compare tools. Experiment with different calculators to meet your needs.
| Calculator Type | Best For | Key Features | Typical Output |
|---|---|---|---|
| Academic/Research (University tools) | Detailed studies and comparisons | Indirect water estimates, peer-reviewed methods, exportable data | Comprehensive breakdown by sector and footprint components |
| NGO Resources (Water Footprint Network, WWF) | Education and household benchmarking | Clear explanations, activity-level detail, regional notes | Estimated household totals with activity categories |
| Utility-Provided Calculators | Local accuracy and billing context | Local scarcity factors, ties to rates, smart meter sync | Personalized totals and conservation suggestions |
| Smartphone Apps | Quick checks and habit tracking | Mobile UI, daily logging, reminders, simple reports | Short-term trends and easy-to-read summaries |
| Commercial Online Tools | Balance of depth and usability | Activity breakdowns, export options, privacy settings | Actionable reports suitable for household planning |
Gathering Relevant Data
Start by collecting clear, representative data before using any tool. Keeping a log of your typical activities for a week is better than noting unusual highs or lows. This makes using water footprint calculators quicker and the results more accurate.

Daily Routine Considerations
Write down how many showers everyone takes and for how long. Record the number of people living in your house and guess how many times each person flushes the toilet daily. Also, keep track of how often you do laundry, use the dishwasher, water the plants, and wash the car.
A simple record, like a note on your phone or a small notebook for a week, will help. This way, you avoid unusual data and get a more correct water footprint from the calculator.
Water Usage in Household Activities
If you don’t have exact numbers, use average amounts. Newer showers use about 1.5 to 2.5 gallons a minute, while older ones can use up to 5 gallons. Toilets vary too, with older ones flushing up to 7 gallons and newer, eco-friendly ones using around 1.28 gallons.
Dishwashers use 3 to 5 gallons each time. Handwashing dishes uses more, between 8 to 27 gallons. Washing machines range from 15 to 40 gallons per load, depending on the type. Watering your lawn depends on your sprinkler, but rates can vary a lot.
Look at appliance guides, utility bills, or smart meter readouts for exact numbers. This info helps make water footprint calculators more accurate.
Water Consumption in Food Choices
Gather info on what you eat to figure out water used indirectly. Keep track of how much beef, chicken, dairy, grains, fruits, and veggies you eat weekly. Calculators then convert this into virtual water amounts.
Beef uses a lot more water compared to veggies. Chicken and dairy use less water than beef but more than plants. Tracking what you buy or eat with a meal app or grocery receipts helps make your water footprint calculations better.
Tools to Gather Data
Use a simple log, check your water meter, and look at utility reports. Keeping track of what you buy to eat can also help. These methods improve using water footprint calculators and give you more trustworthy results.
Inputting Your Information
Before you start, gather your recent bills, meter readings, and notes on daily habits. This makes your input more accurate and quickens the use of water usage calculators or water footprint tools. If it asks for your location, pick the United States or your specific state for the right default values and units.
Step-by-step workflow
Learn the steps for using a water footprint calculator efficiently. Each one converts rough guesses into meaningful numbers.
- Choose a calculator designed for U.S. users. Look for one that uses gallons and considers local climates or state-level data.
- Input your household size and location if required. This adjusts the average water use per person and needed for outdoor watering.
- Add direct water use data for showers, toilets, laundry, dishwashing, faucets, and watering outdoors. Use weekly averages for more consistency.
- Enter food and product consumption patterns or select a standard diet and product profile provided by the tool.
- Check the default settings and tweak appliance efficiencies if you know them. Insert appliance age or model for more detailed estimates.
- Submit your data and save the results. Compare them over time to see any changes from month to month.
Interface tips
When asked for appliance details, choose the most similar option. Remember, older models usually use more water than newer, Energy Star rated ones. Always aim low with your estimates to avoid reporting too little.
Change units if needed. Most tools can switch between liters and gallons. Make sure your entries match your region’s standards. Even if a question seems extra, answer it to enhance the accuracy of your results.
Common mistakes to avoid
Many users forget to report everything. Leaving out outdoor watering can mess up your total. Not counting guests or special occasions might affect your average. Data from just one day doesn’t show your real use.
Others don’t adjust for how efficient their devices are or miss indirect water use in food, clothes, and electronics. Trusting the default settings too much without personalizing major inputs can lead to incorrect conclusions.
Validation
After you submit, compare the calculator’s direct-use figures to your actual water bills or readings from a smart meter. Big differences mean you should review and correct your data. This cross-check boosts your confidence in future submissions and teaches you to use the data from your water footprint calculator more successfully.
| Step | What to Enter | Why It Matters |
|---|---|---|
| 1 | Choose U.S.-focused calculator | Ensures correct units and regional assumptions |
| 2 | Household size and location | Adjusts per-capita and outdoor use estimates |
| 3 | Direct use: showers, toilets, laundry | Forms the bulk of measurable household water |
| 4 | Food and product consumption profile | Captures indirect water in diet and goods |
| 5 | Appliance age/model and efficiencies | Improves accuracy of device-related estimates |
| 6 | Save results and compare to bills | Validates entries and shows trends over time |
Analyzing the Results
When you use a water calculator, the results might seem complex at first glance. Taking time to read through the report helps highlight main areas of water use. This makes it easier to see how you can change your habits.
The report shows total water use and breaks it down by category. It’s helpful to look at overall numbers and also details like daily activities or product use. This is when you start turning calculations into real-life actions.
Interpreting Your Results
Most tools tell you how much water you use in a year. They separate water used directly, like in showers, from indirect use in things like food and clothes. Comparing your results to the average can show if you use more or less water than others.
If you use more water than the average person, it’s a chance to cut back. Even if your use is lower, some specific areas might still use a lot of water. It’s good to check where you can make improvements.
Key Metrics to Focus On
Pick a few key points to guide your actions. Compare how much water is used for food versus other home uses. Keep an eye on things that use a lot of water, like eating beef or watering the lawn. Set realistic goals based on how much water you use each day.
Learn about the different types of water use: blue, green, and gray. Blue is for lakes and groundwater, green is rainwater absorbed by soil, and gray is used to clean pollution. Knowing this helps pick the best ways to save water.
Calculators often show a range for guesses about indirect water use. See these numbers as hints rather than exact amounts. This is especially true for water in food and products, which can vary a lot.
Decide which actions will save the most water for the least effort or cost. Start with easy wins like eating less beef, changing when you water your lawn, or fixing leaks.
| Metric | Why It Matters | How to Use It |
|---|---|---|
| Total annual footprint (gallons/liters) | Shows overall water impact and comparisons to averages | Set annual reduction targets and benchmark progress |
| Direct vs indirect use | Reveals whether daily habits or purchased goods dominate use | Target quick wins in direct use and longer-term changes for indirect use |
| Per-person daily gallons | Makes goals personal and comparable across households | Convert to simple daily habits, like shorter showers |
| Food vs household percentage | Identifies diet or home activities that drive the footprint | Prioritize diet shifts or appliance upgrades |
| Largest single contributors | Pinpoints items where small changes yield big savings | Focus efforts on top one or two contributors first |
| Blue/green/gray breakdown | Clarifies source and quality impacts on water use | Choose measures that reduce blue water or pollution loads |
| Uncertainty ranges | Shows confidence in indirect estimates and embedded water | Use ranges to test scenario sensitivity and refine decisions |
Doing the calculations again after making changes helps check your progress. Using a water calculator regularly improves your decisions over time. A good analysis guides you to make smart changes at home.
Identifying Areas for Improvement
After you use a water usage calculator, you’ll see certain areas pop up. Food choices, watering plants, using old appliances, taking long showers, and washing your car often are key spots. Understanding these areas can lead to big cuts in water use.
Here’s why some activities use a lot of water. Raising beef takes tons of water for feed and watering crops. In many places in the U.S., watering lawns and gardens causes water use to spike during certain seasons. Using old washers, toilets, and dishwashers means more water per use. Taking long showers and using a hose a lot can really add up.
High Water Usage Activities
- Red meat and dairy: high embedded water from feed crops and processing.
- Outdoor irrigation: lawn watering and sprinklers create seasonal spikes.
- Inefficient appliances: older washers and toilets consume excess water.
- Long showers: each extra minute increases household totals.
- Frequent vehicle washing: repeated rinses can waste hundreds of gallons.
Tips for Reducing Your Footprint
Small steps can lead to big savings. A water calculator can show you where to focus and measure results. Learning to use these tools helps you see what changes to make.
- Cut red meat: swapping two beef meals per week for beans or tofu can lower embedded water by hundreds of gallons monthly.
- Smart irrigation: install drip lines, water before dawn, and group plants by need to cut outdoor use by 30% or more.
- Upgrade fixtures: switch to WaterSense toilets and a 2.0 gpm showerhead. Replacing a 3.5 gpm with 2.0 gpm can save roughly 450 gallons per month for one person with daily 10-minute showers.
- Run full loads: use full dishwasher and washing machine loads to reduce cycles and water per item.
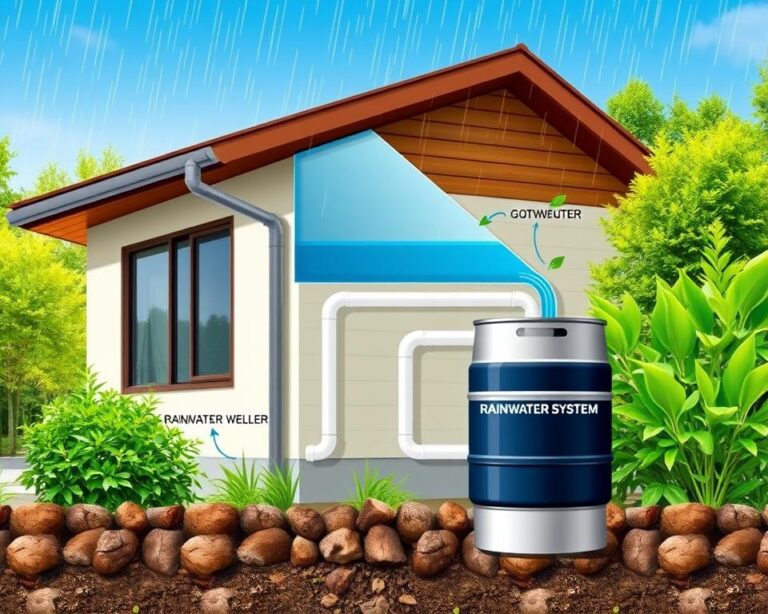
- Rain capture and leaks: install rain barrels where allowed and fix toilet flappers and faucet drips to prevent dozens of wasted gallons daily.
- Choose low-embedded goods: buy durable clothing and products from brands that disclose water footprints, and buy less to lower hidden water use.
- Behavioral tweaks: shorten showers, shut off the tap while brushing, and use a broom instead of a hose for sidewalks.
- Meal planning: planning reduces food waste, which cuts the doubled water cost tied to discarded food.
To compare typical actions, check the table below for estimated monthly savings and effort level. A water usage calculator can personalize these savings for your home.
| Action | Estimated Monthly Water Savings | Effort Level |
|---|---|---|
| Replace 3.5 gpm showerhead with 2.0 gpm | ~450 gallons per person | Low |
| Switch to WaterSense toilet | ~4,000 gallons per household | Medium |
| Install drip irrigation and smart timer | 30–50% reduction in outdoor use | Medium |
| Reduce beef meals by 2 per week | Hundreds to thousands of gallons depending on diet | Medium |
| Fix toilet flapper and faucet leaks | Dozens to hundreds of gallons | Low |
| Run full appliance loads only | 100–300 gallons per month | Low |
Folks who try these tips will notice a change by keeping track regularly. Knowing how to work with water footprint calculators makes it easier to see what to focus on. This way, you can cut down your water use in big, visible ways.
Strategies for Water Conservation
Small changes in our homes and daily lives make a big difference. Learn how to help save water with easy steps and tools to track your progress.
Adjusting Daily Habits
Reduce your shower time to five minutes or use a timer. This saves water and the energy needed to warm it up.
While waiting for the shower to heat, collect the cold water. Then, use it for your plants. It’s an easy way to save water for free.
Skipping just one beef meal a week helps too. Choosing beans or poultry instead can save a lot of water, which you’ll see if you use a water tracker.
Use graywater for your garden, but only if it’s okay where you live. Always check your local guidelines before setting up a system.
Buying less and planning your meals can also conserve water. Being mindful about what you consume reduces the need for laundry and food water, which a tracker will show.
Home Efficiency Improvements
Installing EPA WaterSense toilets and fixtures helps save on water use. You might even get a rebate for making the switch.
Upgrade to efficient appliances like washing machines and add low-flow aerators to taps. These save water and energy, making your home more efficient.
Always fix leaks quickly. A leaky tap can waste lots of water, messing up your water tracking.
Insulating your pipes helps get hot water faster, reducing wasted water. It’s a smart move for saving both water and time.
Smart irrigation tools and soil sensors help keep your garden watered just right. Look into local programs that offer incentives for water-wise landscaping.
For rain barrels and big water projects, make sure you follow your local rules and get any needed permits. It ensures everything is safe and legal.
Going green can also save you money. Lower bills often follow water and energy-saving upgrades. Using a tracker can show you the financial benefits over time, helping you commit to sustainable water use.
Tracking Progress Over Time
Keeping track of water usage lets people see if little steps make a difference. A clear starting point is essential. Then, checking regularly reveals trends and aids in setting achievable goals.
Setting Sustainable Goals
Use the SMART approach to make goals that are clear and quantifiable. Aim to lower your home’s water use by 15% in six months. Or try to use 25% less water from meat in three months. Short goals might be taking shorter showers three times a week.
Making long-term plans could mean getting a low-flow setup or a new toilet within a year. Writing goals and dates makes them more real. It’s easier to follow them with steps like changing irrigation timers or eating plant-based meals twice a week.
How to Use the Calculator Regularly
Start with a reliable measure from a water footprint tool. Then, check your direct use every month and do a full re-check every three months for diet and lifestyle shifts. Once a year, do a thorough review.
Track your results and bills with tools like Flow.io, Flume, or Phyn for exact numbers. Keep records in a spreadsheet or notes app, noting the date, changes, and impact on your water footprint.
Remember to log seasonal uses such as watering the lawn or having guests. This helps tell the difference between actual progress and regular changes. Looking at changes before and after making a change shows how much you saved with that action.
To really see trends, focus on averages over time, not just one month. If weather affects monthly use, a three-month average will show if savings last. Change your plans if you stop improving or if things outside your control happen.
Community Engagement and Awareness
Talking about water savings can create a big wave of change. When people use a water usage calculator, they can turn their findings into stories that are easy to share. They can use simple summaries, easy-to-understand infographics, and neighborhood meetings to spread the word.

It’s helpful to start with a starting point, list the steps you took, and then show the results. Posts on social media that show the difference made inspire others. Schools and community centers like when someone explains how to analyze their water use in a simple way.
Getting involved in local efforts makes a bigger difference. You can join groups that look after watersheds, take part in conservation programs from your utility company, or help nonprofits like American Rivers. There are also EPA WaterSense campaigns and city rebate programs that make it easier to use less water at home.
Challenges help get neighbors involved. Some ideas are having a competition to save water for a month, making meals without meat for a week, or buying water-efficient fixtures together. Working together for grants that replace lawns with something that needs less water or get more efficient appliances can help everyone save money and water.
When residents get involved, they can help change policies. Making public comments on city water plans and supporting policies for sustainable water use can get more money for better infrastructure. Advocacy can lead to fair access to water and long-term saving strategies.
Below is a helpful guide for communities to find actions that fit their goals and what they have to work with.
| Action | Effort | Cost | Impact on Water Footprint Analysis |
|---|---|---|---|
| Create neighborhood infographics from a water usage calculator | Low | Minimal | Improves awareness, shows measurable household savings |
| Join local watershed or utility conservation programs | Moderate | Low to none | Provides resources for lasting reductions |
| Organize a water-saving community challenge | Moderate | Variable | Encourages behavioral change across many households |
| Coordinate bulk purchase of efficient fixtures | High | Moderate upfront | Large drop in household use once installed |
| Advocate for municipal sustainable water management policies | High | None | Leads to system-wide benefits and equity |
Resources for Further Learning
This section introduces books, articles, courses, and data sources on water use and conservation. It includes scientifically supported references and tools for water footprint analysis. These help make informed decisions daily.
Books and Articles
Begin with resources from the Water Footprint Network and EPA WaterSense for solid, researched info. Look into university articles for insights on the water hidden in products.
Notable sources are Hoekstra on virtual water, the US Geological Survey for water use figures, and Kate Raworth on eco-friendly living. Also, local guides offer specific tips to save water.
Online Courses and Workshops
Explore Coursera or edX for classes on water sustainability and management. The American Water Works Association has webinars for both experts and the public.
Local groups also provide practical workshops on eco-friendly gardening and using graywater. Pair these with online courses to apply knowledge effectively.
Tools, Data Sources, and How to Choose Them
Use reliable data for accurate water consumption calculations. The USDA offers insights on food’s water needs, while the USGS shows water use trends. The Water Footprint Network gives data on water within products.
For checking home water use, try utility web pages or smart-meter tools. Always compare findings with reliable sources like the EPA. This ensures your calculations are correct.
Pick trustworthy sources for your research. Cross-checking different materials ensures your water footprint methods are accurate and widely accepted.
Conclusion and Call to Action
Our choices have a big impact. When we use less water at home, it helps our local water sources. It also makes areas more drought-resistant and reduces pollution. Using a water footprint calculator shows us where we can use less water. It’s an easy step towards using water more wisely.
Getting started is easy. First, choose a good water footprint tool. Then, track your water use for a week. After that, see where you use the most water. By making a few changes, like taking shorter showers or using an ENERGY STAR dishwasher, you can make a difference. Remember to keep an eye on your progress.
Tell your friends and neighbors about what you’re doing. Joining local groups can make an even bigger difference. Small changes, like using efficient appliances and making smart food choices, really add up. Try it out: do your first water use calculation this week. Check again in three months to see the improvements. You’ll be surprised at the difference you can make!
FAQ
What is a water footprint calculator and why should someone in the United States use one?
How does a water footprint tool account for direct versus indirect water use?
How should someone choose the right water footprint calculator?
What data is needed to run an accurate household water footprint analysis?
What are common mistakes people make when inputting information into a water usage calculator?
How should results from a water consumption calculator be interpreted?
What practical steps reduce a household’s water footprint most effectively?
How can someone set realistic water-saving goals and track progress?
Are there tools or incentives to help pay for home water-efficiency upgrades?
Can a household use a water footprint calculator to inform community or policy action?
What authoritative resources offer deeper learning and data for water footprint analysis?
How often should someone recalculate their water footprint?
How can users account for regional water scarcity when interpreting their footprint?
What immediate actions can someone take after their first water footprint calculation?
Field Scenario: High-Heat Week Water Strategy
In high-evaporation conditions, timing and flow rate matter more than total volume. Prioritize early-morning cycles, soil-moisture checks, and zone-based adjustments.
Implementation Checklist
- Measure baseline water usage for 7 days
- Adjust one variable at a time (timing, duration, frequency)
- Track plant stress signs before increasing volume
- Review results weekly and lock the best pattern
Common Errors
- Increasing water volume without checking runoff
- Ignoring soil type and absorption speed
- Using fixed schedules across weather changes
Quality Enhancement Update: 2026-03-05 — This article was refined with scenario-based guidance, implementation checklists, and measurable decision steps to increase practical value and reduce generic repetition.
Editorial Note: For policy and methodology, see Editorial Policy.
Article Trust & Methodology
Author: Rosalie Clark
Editorial Review Date: 2026-03-05
Purpose: Deliver practical, user-first guidance with clear limitations and realistic implementation steps.
How this article was prepared
- Topic intent mapping based on common reader problems
- Step-by-step structure with measurable checkpoints
- Risk notes and scenario-based adjustments
- Readability review for mobile and desktop
Who this article is for
This content is for everyday readers who need practical decisions they can apply safely and consistently, not theoretical advice only.
Sources and validation approach
Recommendations are organized around established best-practice principles (measurement, controlled testing, and periodic review). Readers should adapt guidance to local regulations, climate, infrastructure, and budget constraints.
For editorial standards and correction requests, see Editorial Policy and contact contact@everydaytechfinance.com.
Final Implementation Notes
For best outcomes, avoid changing multiple variables at once. Build a small decision log, review results weekly, and keep only changes that improve measurable outcomes over time. Consistency and clarity are more important than intensity.